56% of apparel and footwear brands now report return rates at or above 30%, according to Radial’s State of Retail Returns 2025, a survey of 200 retailers fielded in July 2025. Read that number again: for the majority of the industry, nearly one in three online orders comes back.
Footwear ecommerce teams are measured on conversion, so that’s what they optimize for—the funnel, the checkout, the ad spend. The return rate gets treated as a cost of doing business. But the PDP that won the sale is very often the same PDP that caused the return: too few images, no on-model context, no sense of scale, and no styling that tells a shopper what the shoe is actually for.
Between what a product page shows and what a shopper needs to know is a merchandising problem, and merchandising decisions are what close it. This playbook covers what footwear ecommerce merchandising involves, why shoe PDPs underconvert, what returns actually cost, the levers that move average order value (AOV), how to get colorway coverage without a photoshoot per variant, and how to evaluate a merchandising platform.
Key Takeaways
- A third of shoppers returned an item because it didn’t match its online description or images (Rithum, 2025).
- 42% of users try to work out sizing from product images alone, yet 23% of sites provide no human model images (Baymard Institute, 2026 benchmark).
- Footwear merchandised as a look outperforms footwear merchandised as a SKU: JD Sports’ Shop the Model placements drive 50% of total widget revenue.
- Footwear ecommerce merchandising is a margin lever, not a styling exercise — the returns line moves further than the conversion line.
Footwear ecommerce merchandising is the discipline of presenting, contextualizing, and connecting shoe products online. It is the process of threading the needle between imagery, outfitting, product attributes, and on-site placements, so shoppers can judge fit and purpose before they buy. It’s the digital counterpart to in-store visual merchandising, with one crucial difference: its success metric includes the return rate, not just sell-through.
That distinction matters because most people searching for shoe merchandising information arrive with an in-store mental model. Search for footwear merchandising and you will mostly discover window-display galleries. None of that transfers to a product page. Online, the store window is the image gallery, the floor set is the product listing page, and the sales associate suggesting a matching belt is an outfitting module.
In practice, footwear merchandising has four working parts:
- Imagery — the shots that let a shopper resolve scale, proportion, texture, and how the shoe sits on a foot.
- Outfitting and bundling — the styling context that answers “what does this go with?” at the moment of highest intent.
- Catalog enrichment — the product attributes (occasion, activity, season, style) that power search, filtering, and recommendations.
- Placement — where all of the above appears: PDP, PLP, cart, email, and editorial.
Footwear is a distinct case within fashion because it compounds three problems at once: fit ambiguity (a size 10 is not a size 10 across brands), colorway proliferation (one silhouette, a dozen variants, three seasons), and outfit dependency (a shoe is almost never bought for what it is, it’s bought for what it completes). Baymard Institute’s product-page research finds that 42% of users attempt to determine size from product images alone. That tells you how much weight the merchandising layer carries when the product can’t be touched.
At a $100M–$5B retailer, no single team owns all of this. Ecommerce owns the placements, merchandising owns the assortment logic, and creative owns the imagery. This is why successful merchandising as a discipline needs a shared playbook rather than three separate ones.
Because shoppers can’t resolve fit and purpose from the assets provided. Baymard Institute’s benchmark of 155+ leading ecommerce sites finds that 23% don’t provide human model images and 37% don’t provide “in scale” images — so the shopper either abandons, or buys two sizes intending to return one.
Every footwear PDP has to answer three questions, and most answer none of them well:
- Will it fit? Size charts help, but shoppers don’t trust them across brands. They look at the images — and when the images are a flat lay on a white background, there’s nothing to look at.
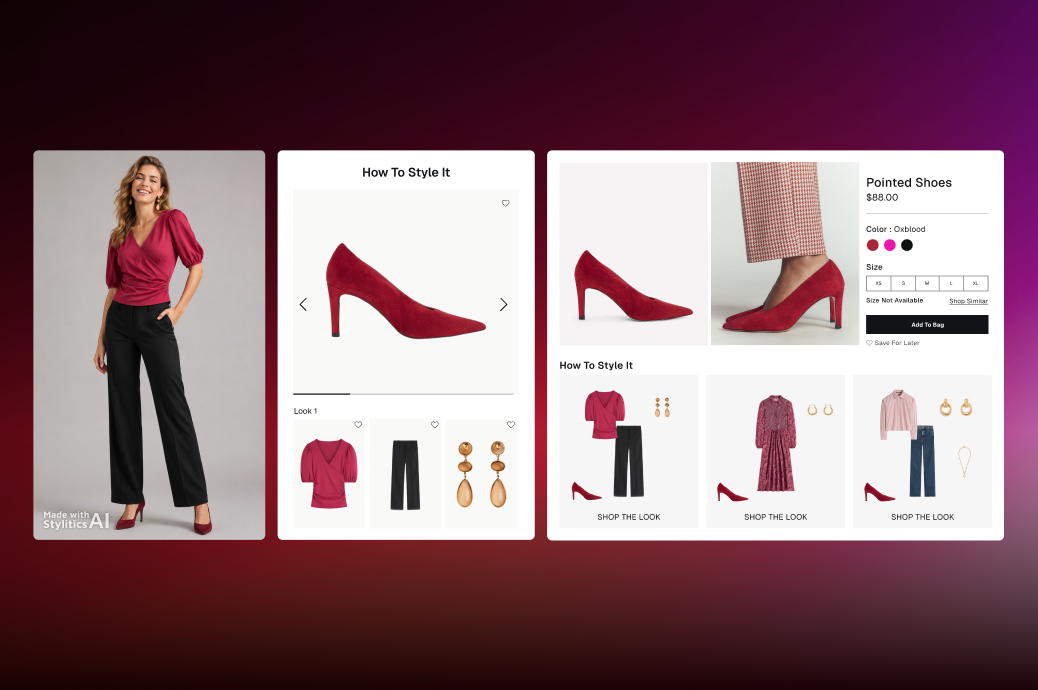
- What does it go with? A shoe out of context is a commodity. A shoe styled into a look is a decision the shopper can picture themselves in.
- What does it actually look like when I wear it? Proportion, drape of the trouser over the shaft, how chunky the sole reads at ankle height — none of this survives a top-down product shot.
Flat-lay and mannequin imagery imposes a conversion ceiling no amount of funnel optimization gets past, because the friction isn’t in the funnel. It is in the shopper’s confidence. The evidence shows up in behavior: Rithum’s 2025 Global Returns & Profit Impact Report, a survey of more than 6,000 consumers, found that 36% of shoppers admit to overbuying with the intention of returning part of the order — rising to 50% among under-35s.
The industry calls that bracketing and treats it as consumer misbehavior to be policed with return fees. It’s more useful to read it as a merchandising failure signal. A shopper who brackets is telling you, in the P&L, that your product page didn’t give them enough confidence to buy one size.
For context on the baseline: fashion ecommerce converts at 1.70% with an average order value of £85.58 in the Fashion Clothing & Accessories segment as of June 2026, per IRP Commerce’s live market data. There is no public footwear-only cut — footwear sits inside that segment — which is itself worth knowing: teams benchmarking against “industry average” are benchmarking against a blend.
More than the shipping label. US retail returns reached $849.9 billion in 2025, with an estimated 19.3% of online sales returned, according to the National Retail Federation and Happy Returns, whose research covered 2,006 consumers and 358 ecommerce professionals at $500M+ merchants. In apparel and footwear the rate runs far higher: 56% of brands report 30% or more (Radial, 2025).
Most “footwear returns are 30–40%” claims circulating in blogs trace back to undated surveys or to nothing at all. Radial’s figure — 56% of apparel and footwear brands at or above 30% — is the best dated proxy available, and it’s damning enough on its own.
The cost of each return stacks up in layers most conversion dashboards never see:
- Reverse logistics — the label, the carrier, the receiving dock.
- Processing — inspection, regrading, repackaging or disposal.
- Markdown — a returned seasonal shoe often re-enters inventory after its full-price window has closed.
- Lost margin on the resale — the second sale of the same unit is almost always at a lower price than the first.
And the pressure valve retailers used to reach for is closing. Rithum’s 2025 research found 88% of consumers now expect free returns — meaning the “charge for returns” lever costs you the sale, not the return. The same study found 61% of consumers cite poor fit as a top reason for returning, and 68% returned clothing or shoes in the past 12 months.
The practical exercise for any VP of Ecommerce: model what a two-to-three-point return-rate reduction is worth at your GMV. Take online revenue, multiply by your return rate, and cost each returned order at full reverse-logistics-plus-markdown value rather than shipping alone. At footwear return rates, that number routinely embarrasses the conversion-optimization roadmap sitting next to it. This is why merchandising deserves framing as a margin program, not a styling exercise.
The levers that add a second item to the basket. Footwear is bought as part of a look, and retailers who merchandise it that way see it in revenue per session: Huckberry recorded 9.3x higher revenue per session and a 60% AOV lift among shoppers who engaged with outfitting content in the first half of 2025 (engaged versus non-engaged cohorts — directional rather than causal, a caveat worth keeping).
The metric that connects merchandising activity to AOV is the attach rate — how often a footwear purchase carries a second item with it. Conversion tells you whether the shoe sold; attach rate tells you whether the merchandising worked. Three lever families move it.
Cross-sell and Complete the Look on footwear PDPs
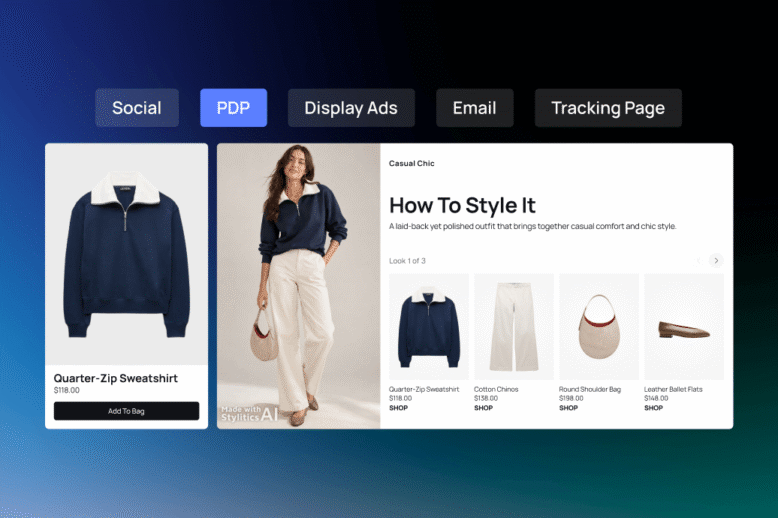
Complete the Look placements answer the question a footwear PDP leaves open — what does this go with — at the moment of highest intent, right beside the add-to-cart decision. JD Sports’ deployment shows the ceiling: Shop the Model placements drive 50% of total widget revenue, with a 2.87x bundle-click multiplier versus standard placements.
Execution details that separate a working module from decoration:
- Position it after size selection, before the fold ends. The shopper deciding on the shoe is the shopper most open to the rest of the outfit.
- Choose complements by occasion and activity, not category adjacency. A trail runner pairs with a running jacket and technical socks — not with whatever else is discounted in men’s.
- Have substitution rules. When a complement goes out of stock, the look should heal itself with a Shop Similar alternative, not display a dead slot.
Dynamic bundling and full-look merchandising
Bundling moves units per transaction before it moves conversion, which is why it shows up in revenue per session before it shows up in the conversion report. Suzanne’s recorded 5.67x revenue per session and a 35% AOV lift with full-look bundling; Huckberry’s same-period data showed a 60% lift in units per transaction.
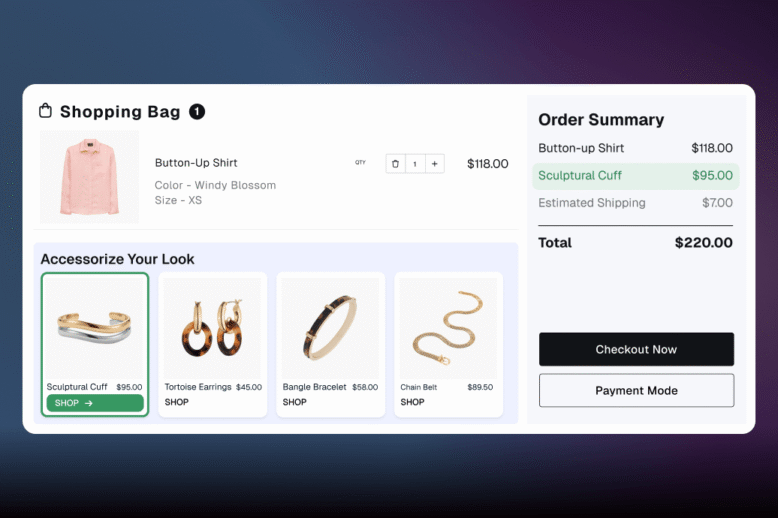
The difference between bundling that works and bundling that annoys is the data underneath it. Co-purchase history alone produces “people also bought” noise. Bundles built from styling data — what actually constitutes a coherent look, by occasion, season, and brand aesthetic — produce outfits a merchandiser would sign off on. Margin-aware construction and exclusion rules (no bundling the clearance rack into the hero look) keep the program aligned with the merchandising calendar. And the placements shouldn’t stop at the PDP: cart, post-purchase email, and editorial all carry full-look modules profitably.
Personalized outfitting without third-party cookies
Personalized outfit recommendations can be built entirely from first-party signals. For example, recently viewed products, purchase history, size and fit data matter more than ever as third-party identifiers disappear. Styled for You placements personalize the look, not just the product, and they run on data the retailer already owns.
The urgency here is external. Adobe’s analysis of 2026 Prime Day, drawn from more than a trillion visits to US retail sites, found AI-sourced traffic converted 40% better than non-AI channels — having converted 23% worse just a year earlier. Shopping-related generative AI searches grew 4,700% between July 2024 and July 2025, per McKinsey and The Business of Fashion’s State of Fashion 2026. Shoppers increasingly arrive pre-qualified by an AI intermediary that has already read your product data. Rich, well-structured, personalized merchandising is what that intermediary has to work with.
By generating on-model variants from existing assets rather than shooting each one. The coverage math is what breaks traditional production: one running silhouette can ship in a dozen colorways across three seasons — thirty-six variants against a studio calendar that might accommodate a fraction of that before the season’s selling window closes.
The consequence isn’t abstract. Variants that miss the shoot ship with a flat lay or nothing, converting at the bottom of the range and generating the returns described above. So the operational question for footwear ecommerce leaders isn’t “should imagery be better” — it’s “how does every colorway get on-model coverage inside the lead time?”
Generative AI on-model imagery answers it in three moves:
- Flat lay to model — a styled, photorealistic on-model image generated from the flat-lay asset the retailer already has, with pose control.
- AI colorway generation — every color variant rendered from a single reference shot, so the twelfth colorway gets the same PDP treatment as the first.
- Scene swaps — studio or lifestyle settings applied without a location shoot, so the same shoe can appear in the context its audience shops in.
Retailers are already reallocating budgets in this direction. Cloudinary’s 2025 survey of 400+ retail leaders found 62% investing more in video, 53% prioritizing virtual try-on, 46% building AR/VR experiences, and 36% rolling out 3D spin-sets — visual commerce is where the money is moving.
The question that should decide any vendor evaluation, though, is quality control: who reviews generated assets before they hit the PDP, and against what standard? For footwear this is unforgiving — sole geometry, lace and eyelet detail, upper texture, and how the shoe actually sits on the foot are exactly where generation goes wrong, and exactly what a shopper zooms in on. Stylitics runs fashion-trained human-in-the-loop QC on every generated asset, at a capacity of 15,000–20,000 on-model images per month, precisely because a photorealistic image with the wrong sole profile is worse than no image: it converts the sale and then guarantees the return.
The evidence points both ways at once, better imagery lifts conversion and removes a named return driver. A third of shoppers say they returned a product because it didn’t match its online description or images, per Rithum’s 2025 report. That single finding converts imagery accuracy from a brand-aesthetics choice into a return intervention.
What on-model context resolves that a flat lay cannot: scale (how big does this actually read), proportion (where does it hit against the leg), styling (what register of outfit does it belong to), and fit expectation (how it sits on a real foot). These are the pre-purchase questions whose unanswered versions become return reason codes. Meanwhile Baymard’s benchmark shows how much of the market still fails the basics: 23% of sites provide no human model images at all, 37% no in-scale images — while 42% of users are trying to determine sizing from images.
Model diversity belongs in this section as a fit-accuracy issue, not only a representation one. A shoe shown on one body type answers the fit question for one body type. Inclusive model imagery — adjustable size, height, and skin tone at scale — extends the answer to the shoppers who were previously guessing, and guessing is what brackets orders.
Two practical disciplines close the loop:
- Sequence the gallery deliberately. On-model hero, in-scale shot, detail crops, and the styled look — each shot earns its slot by answering a distinct pre-purchase question.
- Measure imagery like merchandising, not creative. Read PDP engagement, add-to-cart rate, and return reason codes together. The teams that only watch conversion build the business case backwards — the returns case for imagery is the stronger one, and it’s the one that survives a CFO review.
By building the look at the product-data layer, so every shoe carries the context of what it goes with. This is where footwear diverges from most categories: the shopper is rarely buying a shoe in isolation. They’re buying an outcome — a running kit, a work rotation, a going-out look — and the shoe is the anchor of it.
Here’s the argument this playbook has been circling: merchandising footwear as an isolated SKU is the shared root cause of both the conversion plateau and the return rate. A shopper who can’t see what the shoe is for can’t judge whether it’s right — so either they don’t buy (conversion), or they buy on incomplete information and send it back (returns). Fixing the two problems separately, with a CRO program on one side and a returns-policy program on the other, treats symptoms while leaving the cause on the page.
Merchandising the outfit instead requires infrastructure, not intent:
- An outfit graph. Styling relationships between products — what pairs with what, by occasion, season, and brand aesthetic. Stylitics has spent a decade building this from stylist-curated data across 175+ retailer deployments; it’s the layer that makes automation trustworthy rather than random.
- Enriched product attributes. Catalog enrichment fills in what feeds rarely carry — occasion, activity, style descriptors — so the outfit logic has something to reason over. It compounds elsewhere too: Boston Proper generated 16.4x ROI from enrichment alone.
- Placements that survive inventory reality. Out-of-stock and over-budget substitution rules keep the look intact when the original complement isn’t available.
- Cross-category attach paths. Footwear into apparel, apparel into footwear, accessories as the third item — the attach opportunity runs in every direction, and clothing drives the volume: at JD Sports, clothing accounts for 88% of widget-driven revenue on what is fundamentally a sneaker destination.
The proof this approach carries to a footwear context is direct: PUMA recorded a roughly 235% conversion-rate boost and a 3%+ AOV increase with Shop the Model placements — outfit-first merchandising, measured on a global athletic brand.
Breadth across imagery, outfitting, and product data — plus a clear answer on who controls the output. Point tools solve one layer: an imagery generator with no styling data can’t build a look, and a styling engine with no imagery can’t fill catalog gaps. Footwear needs both layers working from the same product data.
The evaluation criteria that separate vendors in practice:
- Imagery realism and brand compliance — and specifically, who checks it. Ask whether QC is a human process or a confidence score. Ask what happens when a generated asset is wrong, how long the fix takes, and who does it.
- Styling data depth. Outfit quality is a function of the data behind it. A decade of curated outfitting data produces different results than a model trained on co-purchase logs.
- Catalog enrichment. If the platform can’t repair your product attributes, every downstream feature inherits the gaps.
- Placement coverage. PDP, PLP, cart, email, editorial — full-funnel, or a widget?
- Merchandiser control. Can your team boost, exclude, prioritize, and apply business rules without an engineering ticket — or is it a black box? For footwear, with its drop calendars, exclusivity windows, and seasonal rotations, this question is decisive. Hybrid AI — automated styling with merchandiser override — is the operating model that survives contact with a real merchandising calendar.
- Enterprise track record. Deployment references at your scale are a proxy for whether the platform has met footwear’s edge cases before: size-curve complexity, colorway volume, seasonality.
- Integration and deployment speed. Stylitics’ benchmark is roughly 45 days with minimal development effort, on Shopify, Salesforce Commerce Cloud, Adobe Commerce, and BigCommerce.
On ROI, insist on independently modeled numbers, not vendor slides. Forrester’s Total Economic Impact study of Stylitics found a 10% AOV lift, $3.6M NPV, and 563% ROI — and the methodology is readable, which is the point. For the fuller set of evaluation questions, the Automated Outfitting & Bundling Buyer’s Guide covers what to ask in a demo and which claims to demand evidence for.
With a paired metric set — one conversion metric, one basket metric, and one returns metric — read together. Optimizing conversion alone can raise the return rate and shrink contribution margin, which is how merchandising programs get judged a success and defunded a year later.
The core set:
- PDP conversion rate: did the page sell the shoe?
- Attach rate and units per transaction: did the merchandising sell the look?
- AOV and revenue per session: did the basket grow?
- Return rate by reason code: did the confidence problem shrink? Fit and “not as pictured” codes are your merchandising diagnostics; watch them like a conversion metric.
Testing discipline matters as much as the metrics. A/B testing merchandising placements over full purchase-and-return cycles — not two-week windows — is the only way to see the returns impact, since returns lag purchases by weeks. And one honesty note that vendors rarely volunteer: engaged-versus-non-engaged comparisons overstate impact, because shoppers who interact with outfitting content are already higher-intent. Treat those figures as directional. The cleaner reads come from randomized placement tests and from period-over-period return-rate movement on covered versus uncovered catalog segments.
The benchmark for what a fully-measured program looks like: Rhone recorded a 39% AOV increase and 10x ROI within 100 days, with conversion lifts of 13% in men’s and 8% in women’s — measured, attributed, and reported in a form a CFO could audit.
When you report upward, frame the program as contribution margin, not traffic quality. Merchandising that lifts AOV three points and cuts returns two points is worth more than a conversion win of twice the headline size — it just needs the returns line on the same slide to show it.
See it on your own footwear catalog. Bring a handful of silhouettes and colorways, and Stylitics will show you what on-model coverage and full-look merchandising would look like on your PDPs — with merchandisers in control of the output. Request a demo.



 Shop the Look Let shoppers buy the full outfit directly from any styled image.
 Styled for You Personalized outfit recommendations based on individual shopper preferences.
 Complete the Look Suggest complementary pieces to round out whatever a shopper is already viewing.
 Shop Similar Surface visually comparable alternatives when a specific item is out of stock or out of budget.
 Flat Lay to Model Choose from diverse models with full control over pose, crop, and framing.
 Background & Scene Swaps Place products in clean studio backgrounds, lifestyle environments, or custom lighting moods.
 AI Colorway Swaps Create photorealistic images for every colorway from a single reference shot.
 Model Diversity & Inclusive Imagery Output-ready formats for PDPs, social platforms, and campaign lookbooks.